Pending home sales declined in November, according to the National Association of Realtors. Month-over-month contract activity fell in each of the four major U.S. regions. However, compared to a year ago, all four areas achieved gains in pending home sales transactions.
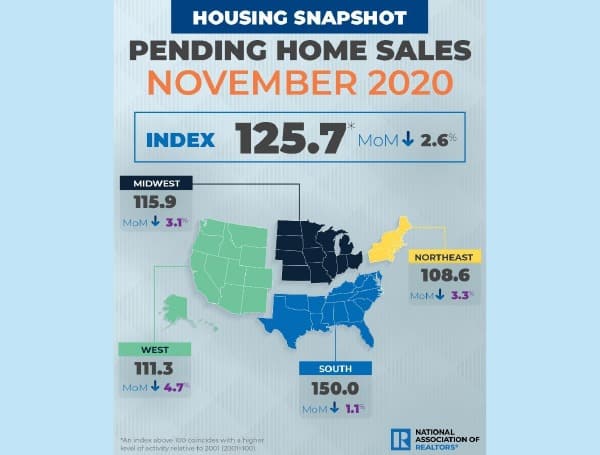
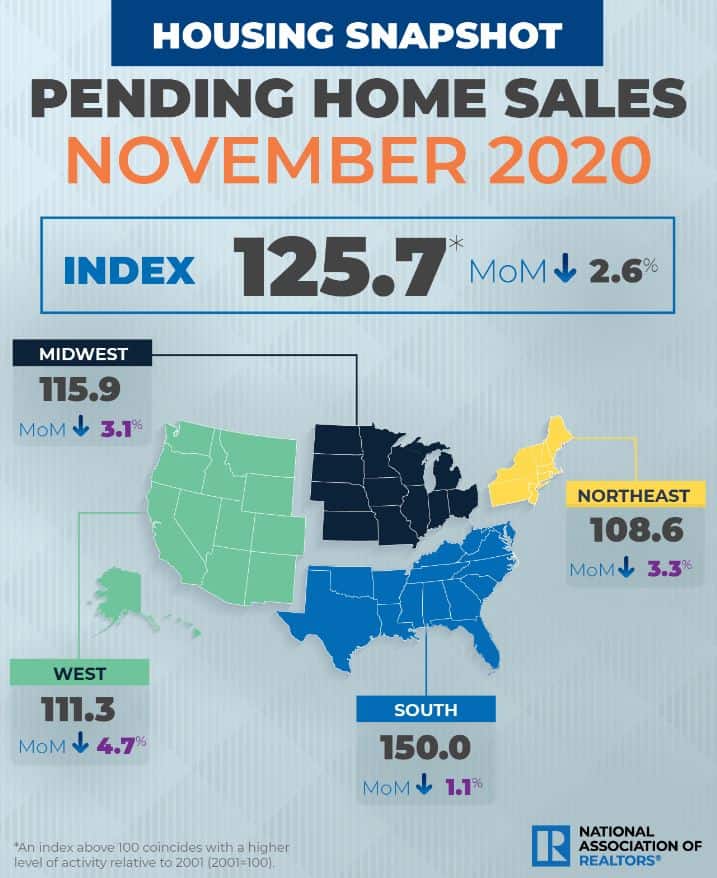
The Pending Home Sales Index (PHSI), a forward-looking indicator of home sales based on contract signings, fell 2.6% to 125.7 in November, the third straight month of decline. Year-over-year, contract signings climbed 16.4%. An index of 100 is equal to the level of contract activity in 2001.
“The latest monthly decline is largely due to the shortage of inventory and fast-rising home prices,” said Lawrence Yun, NAR’s chief economist. “It is important to keep in mind that the current sales and prices are far stronger than a year ago.”
“The market is incredibly swift this winter with the listed homes going under contract on average at less than a month due to a backlog of buyers wanting to take advantage of record-low mortgage rates,” Yun said.
Yun predicts a favorable outlook for the housing market in the coming year. According to his 2021 projections, there will be a slight upward rise in mortgage rates to around 3% from the current 2.7% rate. Existing-home sales are expected to increase roughly 10% and new home sales by 20% next year.
“Economic growth is guaranteed from the stimulus package and from vaccine distribution, but high government borrowing will put modest upward pressure on interest rates,” he said.
November Pending Home Sales Regional Breakdown
The Northeast PHSI slid 3.3% to 108.6 in November, a 15.3% increase from a year ago. In the Midwest, the index fell 3.1% to 115.9 last month, up 14.1% from November 2019.
Pending home sales in the South decreased 1.1% to an index of 150.0 in November, up 21.3% from November 2019. The index in the West fell 4.7% in November to 111.3, which is up 10.4% from a year ago.
The National Association of Realtors® is America’s largest trade association, representing more than 1.4 million members involved in all aspects of the residential and commercial real estate industries.
For more information, you can visit: www.nar.realtor/pending-home-sales
*The Pending Home Sales Index is a leading indicator for the housing sector, based on pending sales of existing homes. A sale is listed as pending when the contract has been signed but the transaction has not closed, though the sale usually is finalized within one or two months of signing.
The index is based on a large national sample, typically representing about 20% of transactions for existing-home sales. In developing the model for the index, it was demonstrated that the level of monthly sales-contract activity parallels the level of closed existing-home sales in the following two months.
An index of 100 is equal to the average level of contract activity during 2001, which was the first year to be examined. By coincidence, the volume of existing-home sales in 2001 fell within the range of 5.0 to 5.5 million, which is considered normal for the current U.S. population.
NOTE: Existing-Home Sales for December will be reported on January 22. The next Pending Home Sales Index will be January 29; all release times are 10:00 a.m. ET.


